Amazon 2Q'24 Update
Disclosure: I own Jan 2025 $55 call options of Amazon
Now that all the big tech reported their quarters, we now have better context to how their quarters went. So, while I will mostly discuss Amazon's earnings in this update, I will briefly touch on some broader themes as well.
Revenue
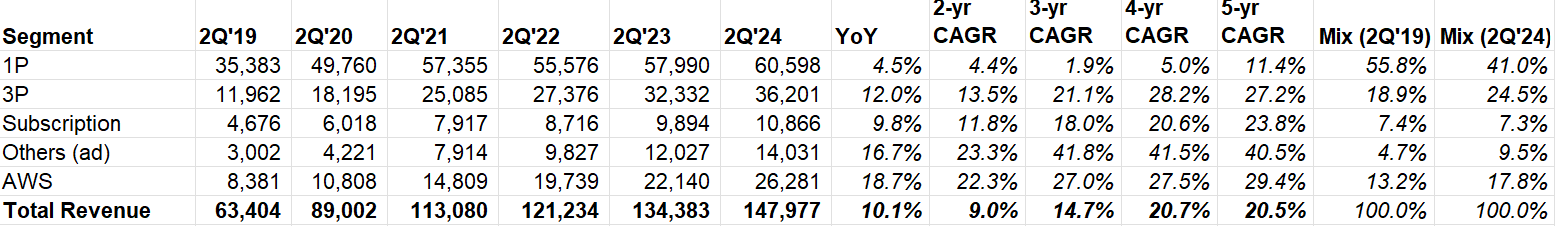
While Amazon’s 1P business (online and physical stores) continues to limp forward, the rest of the business kept their growth momentum.
Advertising decelerated from ~24% YoY in 1Q’24 to ~20% in 2Q’24. AWS, on the other hand, slightly accelerated from ~17% YoY in 1Q’24 to ~19% YoY in 2Q’24 (FXN). I’ll discuss more about AWS later, but let’s talk more about Amazon ex-AWS first.
Amazon ex-AWS
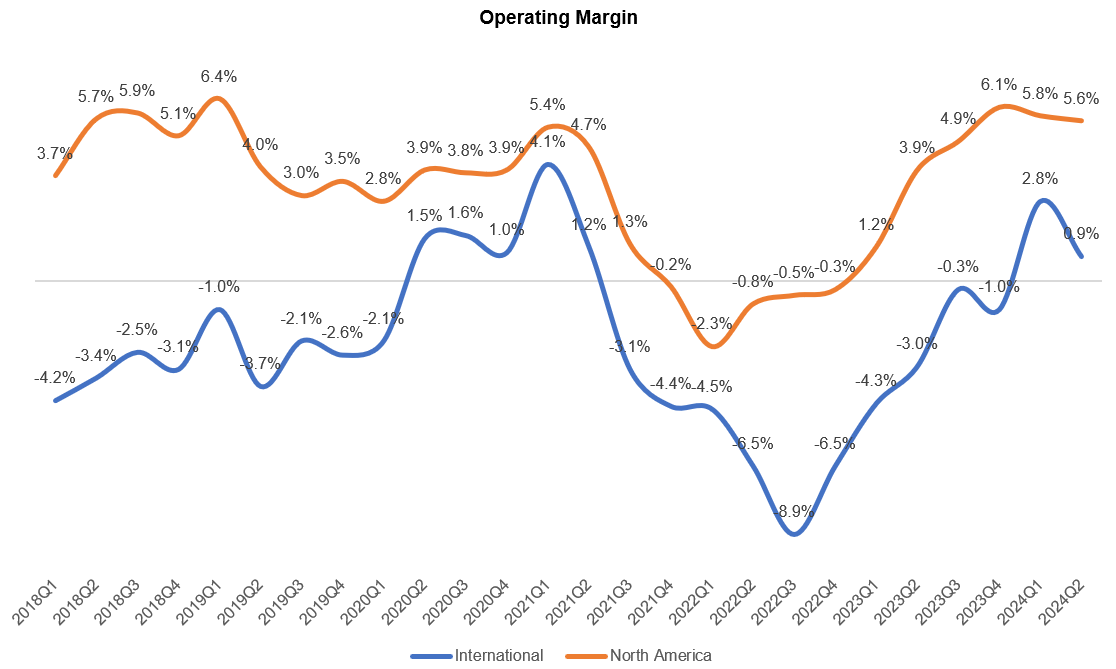
For the second consecutive quarters, North America (NA) operating margins went down QoQ. However, there are more nuances to this headline number as NA store margins actually improved QoQ (management didn’t quantify exact improvement):
If we look at profitability of the core North America stores business, we actually improved our margin again quarter-over-quarter in Q2. The overall North America segment operating margin decreased slightly due to increased Q2 spend in some of our investment areas, including Kuiper, where we're starting to manufacture satellites will launch in the space in Q4.
Some other key quotes on retail business below:
“we're seeing lower average selling prices or ASPs right now because customers continue to trade down on price when they can on more discretionary higher ticket items
our seller fees are a little lower than expected given the behavior changes we've seen from our latest fee changes. While some of these issues compress short-term revenue, we generally like these trends. While consumers are being careful on price, our North American unit growth is meaningfully outpacing our sales growth, as our continued work on selection, low prices and delivery is resonating.
On seller fees, lowering apparel fees has spurred substantial year-over-year unit growth in apparel and the incentive we've given sellers to send their items to multiple Amazon inbound facilities so they can save money where they save us effort and money is getting more traction than we'd even hoped.
These cost improvements won't happen in 1 quarter or 1 fell swoop. They take technology and process innovation with a lot of outstanding execution, but we see a path to continuing to lower our cost to serve”
As you can see below, international margins also deteriorated QoQ. Since Amazon typically have a step up in SBC during Q2, all the segment margin was affected by it this quarter. There wasn’t any other explanation other than the usual which goes like this: “some countries are tracking just as well as the US whereas the emerging countries where Amazon is ramping up is lowering the overall margins”
Fulfillment+ Shipping
If you look at worldwide paid unit growth vs shipping+ fulfillment cost growth, you would notice that the latter used to consistently outpace the former pretty much all the time since 2015 until 3Q'22. Since then, unit growth is faster (was at par in 3Q’23) than shipping+ fulfillment costs, indicating operating leverage in their logistics footprint. That theme continued in 2Q’24 which makes me confident that Amazon retail remains largely on track even if headline margin numbers may give a different impression.

Amazon management also reiterated that there’s more upside left here:
…the first one that you've seen play out over the last year or so has been the regionalization of the U.S. network. And I think one thing to remember about that is that while it had even bigger impact than maybe we theorized when we first architected it, we're still not done fully honing it. There's a lot of ways that we continue to optimize that U.S. regionalization that we think will continue to bear lower cost to serve.
But at the same time, we found a number of other areas where we believe we can take our cost down while also improving the customer experience. One of the great things about regionalization was it not only took our costs served down, but it meaningfully changed the speed with which we're able to get items to customers. And so we have a number of those other opportunities.
…as we're able to take cost to serve down, it means that we're able to afford to have more selection that we're able to offer to customers. And there are a lot of lower ASP items there, average selling price items, that we don't stock because they're not economic to stock with our current cost to serve. But as we work hard to make progress like we are on lowering our cost to serve, that allows us to add more selection. And we see this time in and time out that we -- when we add more selection, customers actually consider us for more of their purchases and spend more with us down the line.
Advertising
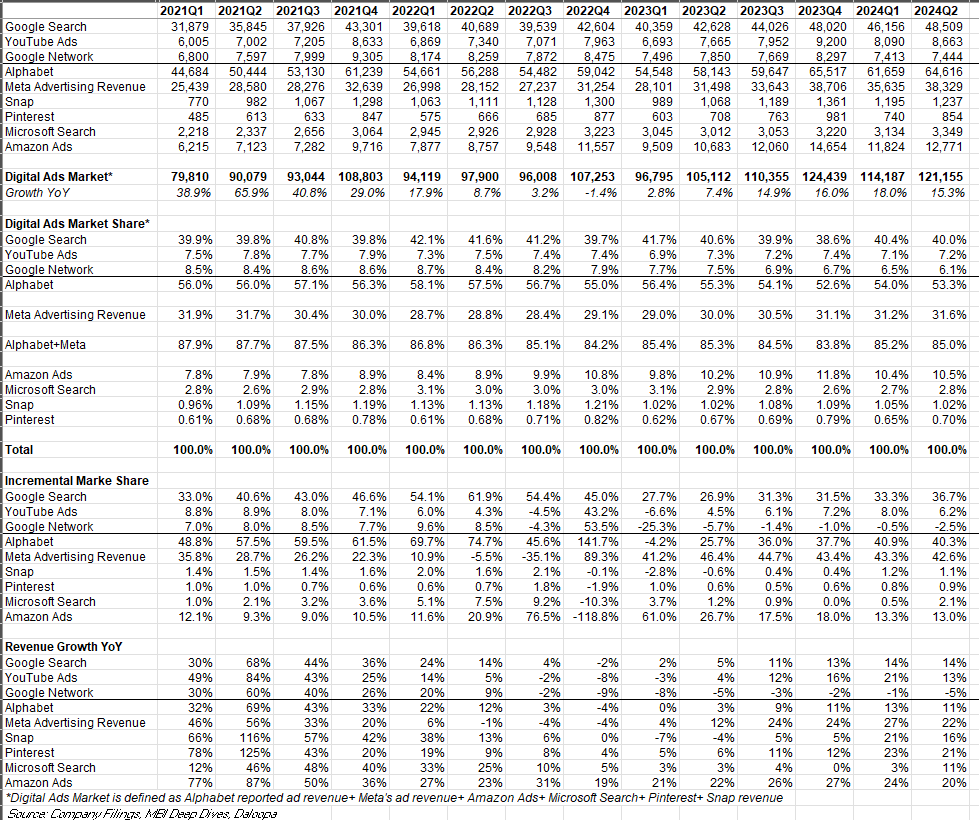
For the second consecutive quarters, Meta grew at the fastest pace among all the digital advertising companies. After looking at other companies’ results, Meta’s 2Q’24 numbers (and even the 3Q guide) appear to be even more impressive.
While Meta has ~30% market share in digital ads (Note: see definition of "digital ads), it has taken >40% incremental ad dollars in the last 6 consecutive quarters. Meta’s incremental share could potentially be higher as Meta’s CFO Susan Li made this interesting comment on the follow-up call:
Our compute needs outstrip our available data center capacity right now. Given the focus that we have on accelerating our GenAI efforts, the new capacity that we've been bringing online is really going more towards GenAI than towards other workloads. We've also had to do a little bit of shifting capacity around to free up capacity for GenAI training. And altogether, we expect that that will result in some foregone revenue growth from ads and organic content ranking improvements that we would have otherwise made, but that has been factored into our Q3 outlook. And we generally expect this to be to be a near term dynamic until we start bringing additional data center capacity online next year, which will meet our capacity needs.
(Note: quite a few subscribers suggested me to include TTD in this table; while I wanted to do that, TTD hasn't reported their Q2 yet, so I will update it once they do)
Amazon ads is now $50 Bn LTM revenue business, and there are still plenty of avenues for growth left:
Sponsored ads drive the majority of our advertising revenue today, and we see further opportunity there. Even with this growth, it's important to realize we're at the very beginning of what's possible in our video advertising.
AWS
Okay, now let’s talk about AWS.
AWS added $1.2 Bn incremental revenue QoQ. The current backlog is $156.6 Bn, growing 19% YoY.

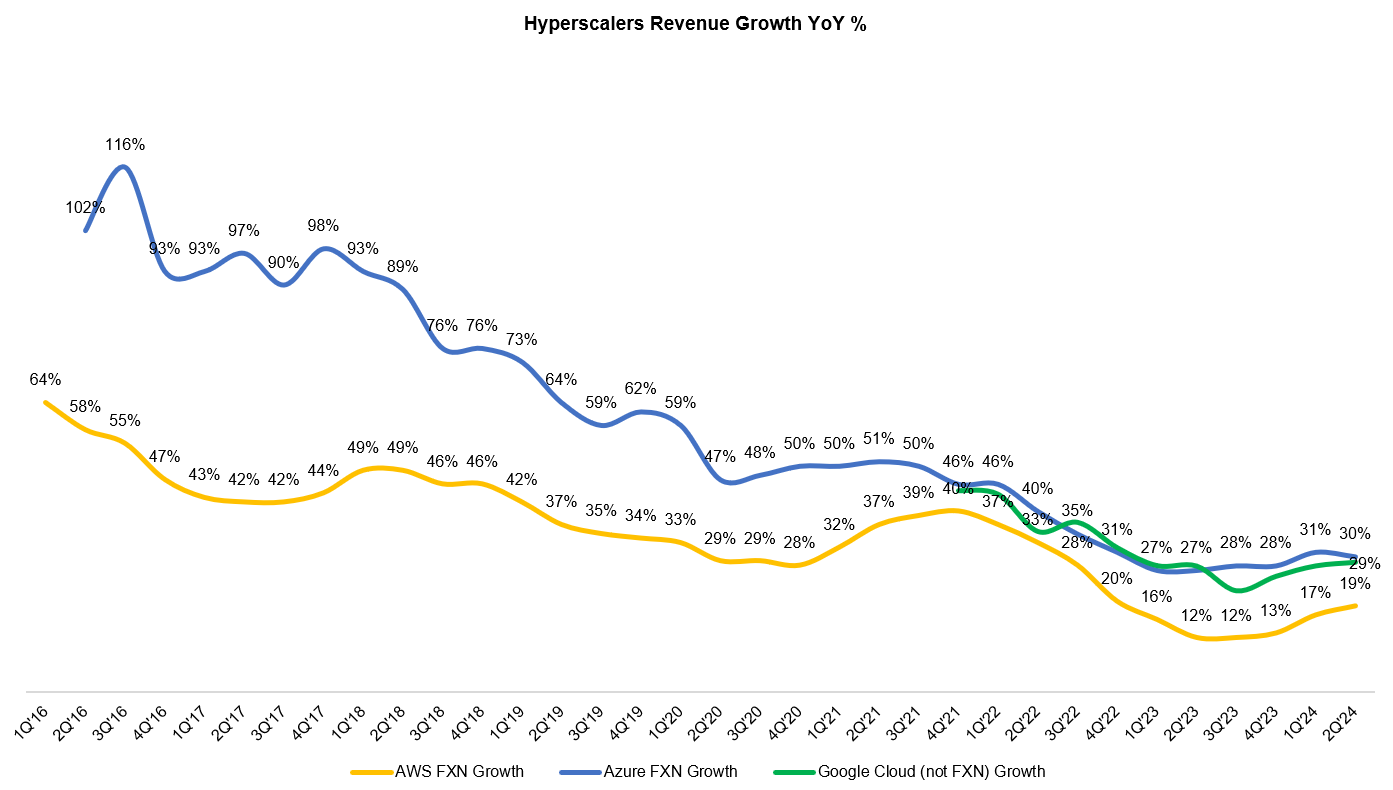
Azure vs Google Cloud vs AWS
Let’s take a quick look at hyperscalers growth. While Azure’s growth has decelerated a bit, AWS and Google Cloud slightly accelerated. Many people seem to care about these 1-2 points of growth acceleration/deceleration; I don’t quite think it matters nearly as much as the attention it gets. It’s hard to complain about these growth rates anyway even if it were 1-2 points lower/higher.
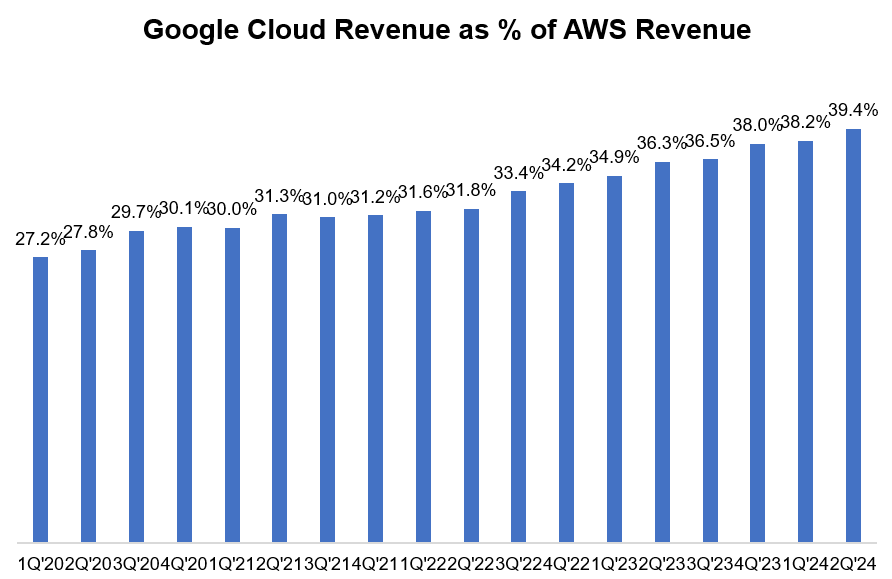
One thing I would like to track is Google Cloud’s operating performance trajectory against AWS. Google Cloud’s both revenue and opex as % of AWS went in the right direction in 2Q’24 although opex improvement perhaps could have been better.
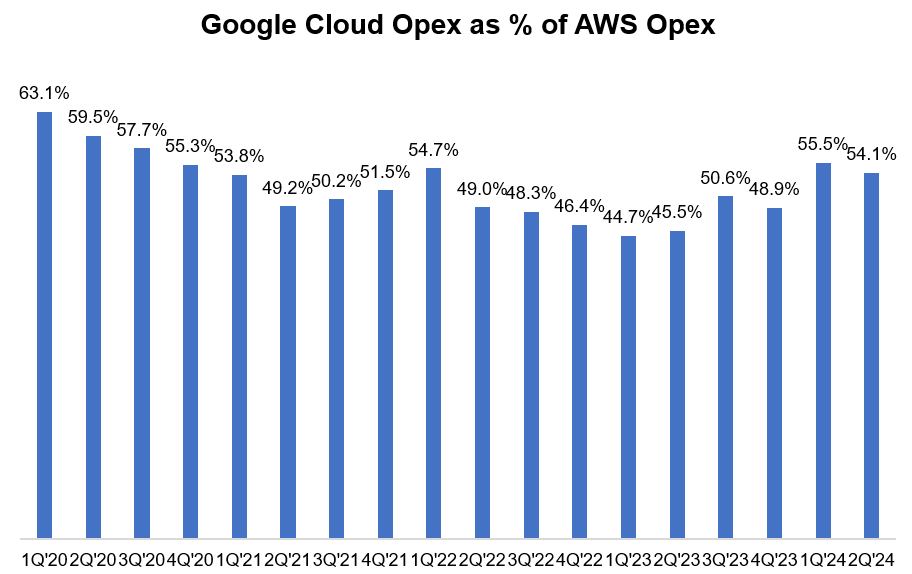
Google Cloud's opex trajectory is likely less of a concern because AWS posted another quarter of eye-watering margins, so it’s hard to keep pace with them. AWS incremental operating margin was 96% in 2Q’24!! Enjoy while it lasts though as we may not see these margins for too long given the massive capex ramp up we are seeing now (and likely will continue to see next year):
AWS operating margin includes an approximately 200 basis point favorable impact from the change in the estimated useful life of our servers that we instituted in Q1.
we expect AWS operating margins to fluctuate over time, driven in part by the level of investments we're making at any point in time.

During Q&A, I found Jassy’s answer to Eric Sheridan’s question really interesting. Just read the whole exchange:

Some other interesting tidbits on AWS from the call:
We're continuing to see 3 macro trends drive AWS growth. First, companies have completed the significant majority of their cost optimization efforts and are focused again on new efforts. Second, companies are spending their energy again on modernizing their infrastructure and moving from on-premise infrastructure to the cloud…And third, Builders and companies of all sizes are excited about leveraging AI. Our AI business continues to grow dramatically with a multibillion-dollar revenue run rate despite it being such early days.
At the heart of this strategy is a firmly held belief which we've had since the beginning of AWS that there is not 1 tool to rule the world. People don't want just 1 database option or 1 analytics choice or 1 container type. Developers and companies not only reject it, but are suspicious of it. They want multiple options for flexibility and to use the best tool for each job to be done.
The same is true in AI. You saw this several years ago when some companies tried to argue that TensorFlow will be the only machine learning framework that mattered and then PyTorch and others overtook it. The same 1 model or 1 chip approach dominated the earliest moments of the generative AI boom, but we have a lot of data that suggests this is not what customers want here either, and our AWS team is determined to deliver choice and options for customers.
Opex+Capex
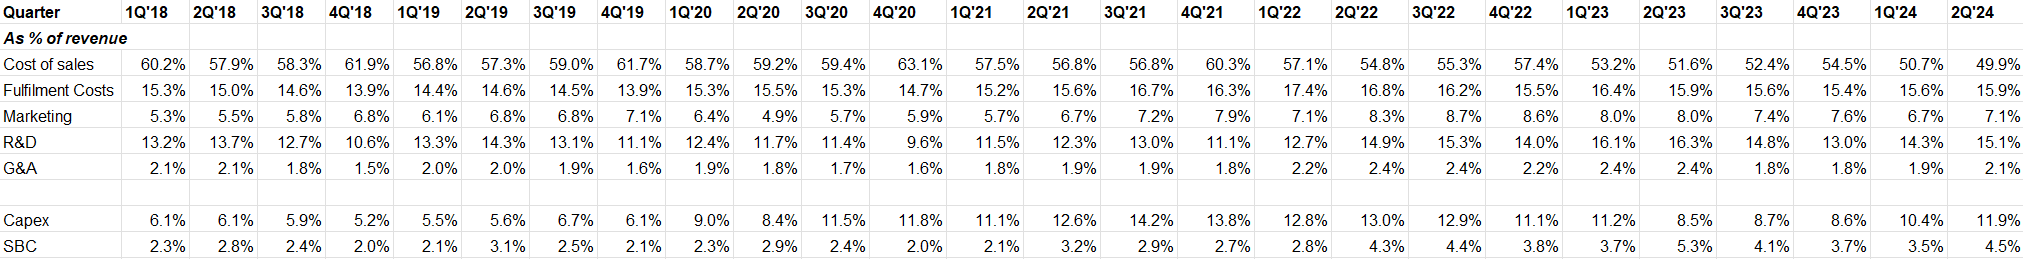
I would caution readers from getting too excited about Amazon's higher gross margins in 1Q'24 since the cost of sales for AWS is actually reported within R&D (or as they say "Technology & Content"). As a result, we don't really know for sure what Amazon's gross margin is. However, looking at its cost of sales as % of revenue and AWS reported operating margin, it is perhaps safe to assume that its gross margin is indeed improving (but just wanted to remind that the lack of hard data as evidence).
Just like other big tech, Amazon's capital intensity has also gone up materially with their increased scale. In 1H’24, they spent $30.5 Bn in capex and expects 2H’24 capex to be higher. What are they spending these capex on?
The majority of the spend will be to support the growing need for AWS infrastructure as we continue to see strong demand in both generative AI and our non-generative AI workloads.
Other Bets
There are some interesting tidbits on Kuiper in this call. While they haven’t disclosed any number yet (and I suspect Amazon’s total investments on Kuiper may surprise its shareholders if it were disclosed), at least we are starting to get some details:
…for Project Kuiper, our low earth orbit satellite constellation, we're accelerating satellite manufacturing in our facility in Kirkland, Washington.
We've announced a distribution agreement with Vrio who distributes DIRECTV Latin America and Sky Brazil to offer Project Kuiper satellite broadband network to residential customers across 7 countries in South America and we continue to field significant demand for the service from enterprise and government entities. We expect to start shipping production satellites late this year and continue to believe this could be a very large business for us.
our Kuiper team is working on how to figure out how to help the 400 million to 500 million households around the world who don't have broadband connectivity get that connectivity and allow them to do a lot of the things we take for granted today with broadband connectivity.
Outlook
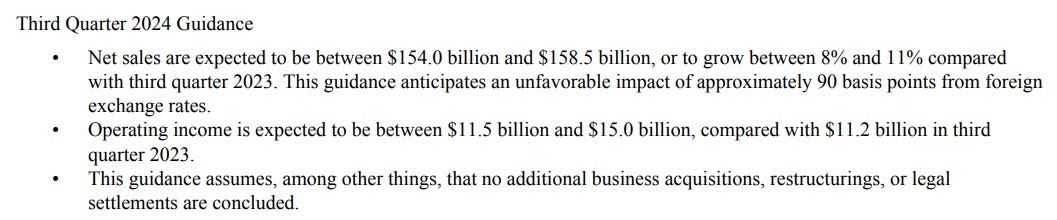
Amazon’s guidance for 3Q’24 is below. Please note consensus 3Q’24 revenue and EBIT before the call were $158.3 Bn and $15.2 Bn respectively.
Closing Words
While the stock went down by ~8% after-hours, this was a fine quarter. Sure, the guidance may be a little soft, but it may likely be because of broader consumer weakness in general. I will stay invested, and may think about adding more to my position at $160 (or below) if it gets there.
For more in-depth valuation discussion of Amazon, see my analysis here (February, 2024).
Please feel free to share with your friends and network. Thank you for reading.
Disclaimer: All posts on “MBI Deep Dives” are for informational purposes only. This is NOT a recommendation to buy or sell securities discussed. Please do your own work before investing your money.