IQVIA Deep Dive
Note: I recorded the audio version of this Deep Dive, but unfortunately the file got corrupted and for some reason, it has randomly deleted 20 minutes of the final version. So, you won’t be able to listen to this month’s Deep Dive. Apologies for the inconvenience.
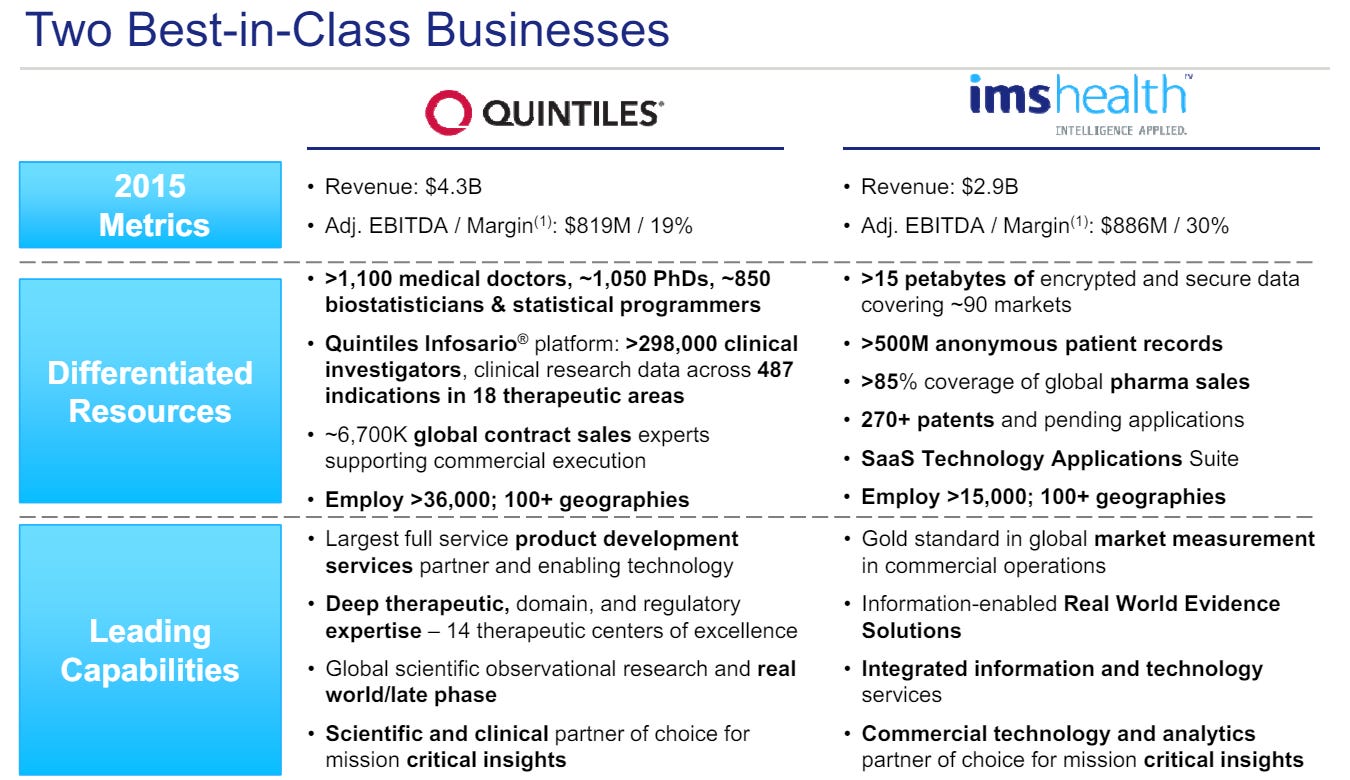
Back in 2016, IMS Health and Quintiles went through a merger of equals to form “QuintilesIMS” which was later renamed to be “IQVIA” in 2017. "I" and “Q” stand for IMS Health and Quintiles respectively and "VIA" means "by way of”. Since IMS and Quintiles both used to be separate public companies, let me discuss these two businesses separately at first before getting into the details of their post-merger status.
IMS Health
IMS, which stands for Intercontinental Medical Statistics, was founded in 1954 by Bill Frohlich and David Dubow. Apparently, Arthur Sackler (for the uninitiated, read about Sackler family owned Purdue Pharma’s role in the opioid crisis in the US) also had a “hidden” ownership stake at IMS.
IMS collects comprehensive set of healthcare information around the world, including sales, prescription and promotional data, medical claims, electronic medical records etc. to deliver information and insights on ~90% of the world’s pharmaceuticals. IMS standardizes, organizes, and integrates 61 petabytes of unique proprietary data sourced from ~150k data suppliers covering over one million data feeds globally.
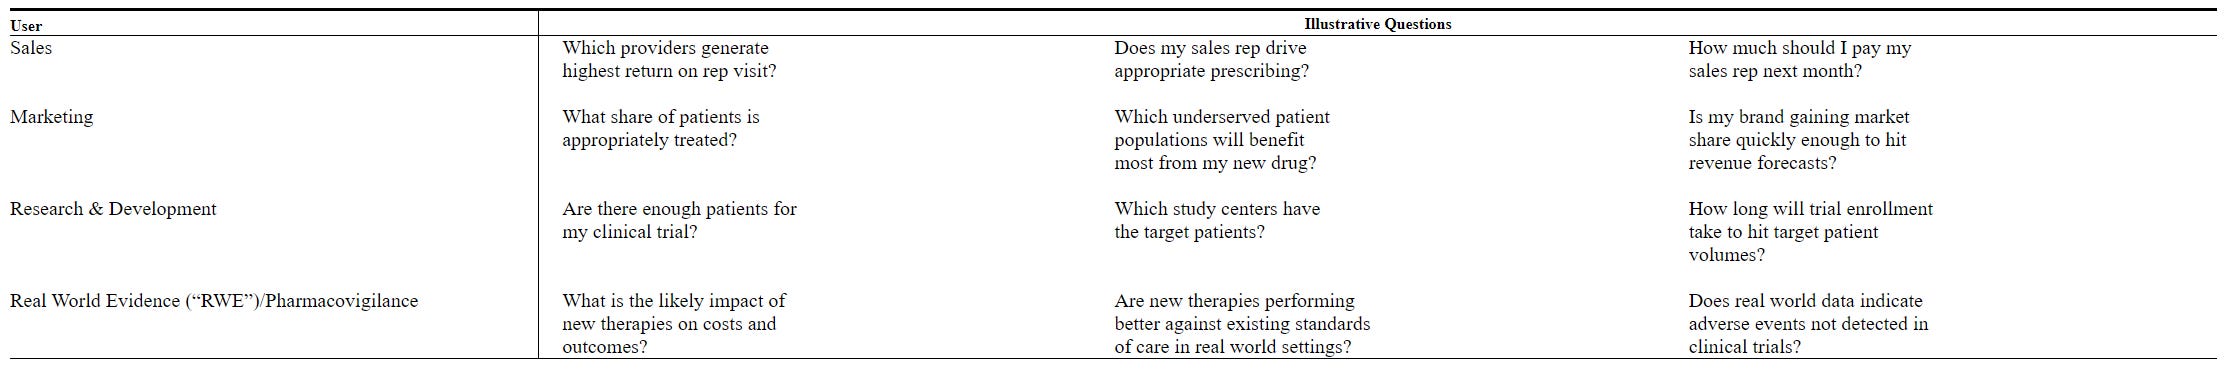
A sales executive may want to know “which providers generate highest return on rep visit”; a marketing executive may wonder “is my brand gaining market share quickly enough to hit revenue forecasts”; a R&D executive may explore “how long will trial enrollment take to hit target patient volumes”. IMS database can come quite handy in answering each of these questions.
As you can imagine, allowing such granular data to be disseminated among pharmaceutical companies has its fair share of critics. IMS, for example, purchases prescription records from pharmacies and sells the information back to pharmaceutical companies who want to monitor the return on their promotional efforts. With the rise of privacy hawks who don’t even want social media companies to deliver targeted ads, you can imagine how buying/selling sensitive health related data would seem like a walking lawsuit. While IMS de-identifies these data while maintaining utility at an aggregate level for their customers, IMS already dealt with these lawsuits in 2000s and by the mid-2010s, regulatory environment on the existential question of the business model itself is largely settled. For the more curious readers who want to dig deeper, I recommend this paper from 2013 which provided good historical background on this issue.
IMS first became a public company in 1972. But it was taken private by late 2009 by TPG Capital, CPP Investment Board and Leonard Green & Partners for $5.2 Bn, including $2 Bn debt. These buyers were able to almost ~2.6x their money in ~4.5 years when IMS again became a public company in April, 2014.
As you can perhaps imagine, it’s quite a sticky business. IMS mentioned in their 2015 10-K that the average length of relationships with their top 25 clients is over 25 years and the retention rate for their top 1,000 clients was 99%. Moreover, ~70% of revenue was recurring in nature.
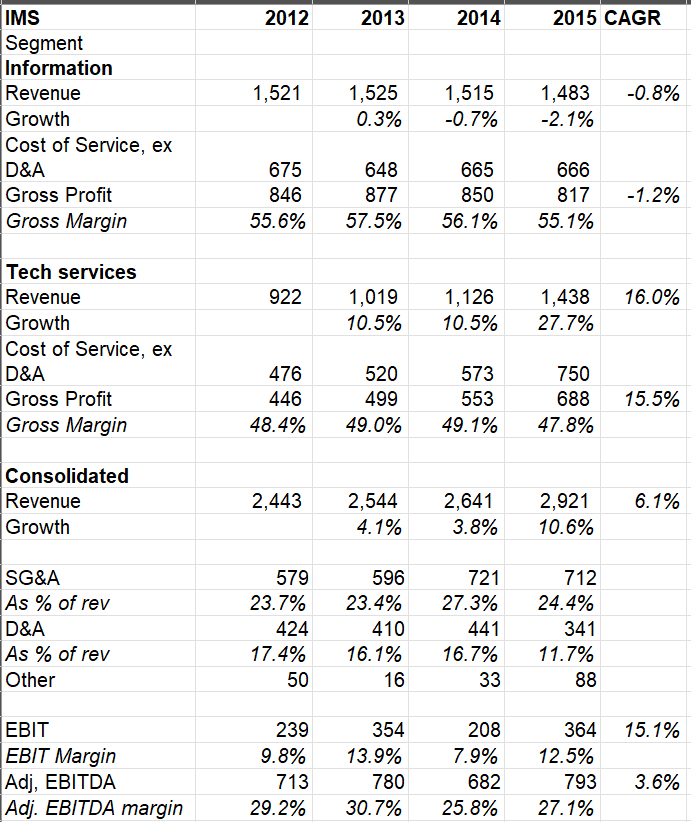
IMS used to segment their revenues in two categories: a) information, and b) technology services. Both these segments largely contributed half of IMS revenue each in 2015.
Their information products provide country or/and regional level performance metrics related to sales of pharmaceutical products, prescribing trends, individual prescriber level (depending on regulation in a country/state), medical treatment and promotional activity across multiple channels including retail, hospital and mail order. Their clients use these data to measure relative performance, assess market opportunity, determine brand and company strategy, and understand market dynamics. ~90% of their information revenue came from subscription or license-based contracts that are sold in a range of frequencies from weekly to annual intervals, and are delivered in a variety of formats, including online hosted, PCs and mobile platforms.
Revenue from technology services consists of a mix of revenue from SaaS licenses such as CRM, performance management, incentive compensation, territory alignment, roster management, call planning, compliance reporting and Master Data Management. Beyond such SaaS licenses, “real-world evidence solutions” enables IMS’ clients to use anonymous patient-level data to understand treatments, outcomes, and costs to inform and advance healthcare decision making. Revenue from workflow analytics and consulting services are also included in this segment.
Information segment is typically higher gross margin business than tech services segment. While a very sticky business, information services is an extremely mature business and revenue was basically flat from 2012-2015 period. Tech services grew at mid-teen CAGR which increased the overall revenue at MSD+ CAGR rate. While a material percentage of business is recurring in nature, it is a labor intensive business as IMS employees need to consistently collect data on regular intervals. It is, however, a capex light business and the business typically generated ~25-30% EBITDA margin during 2012-2015 period when it was a standalone company.
Quintiles
Quintiles, founded by Dennis Gillings, a biostatistics professor at UNC Chapel Hill in 1982, is a leading provider of biopharmaceutical development services and commercial outsourcing services. Quintiles first came to IPO in 1994 but was taken private in 2003 in a $1.7 Bn management buyout. Then in 2013, they came back to public market again at ~$5 Bn valuation.
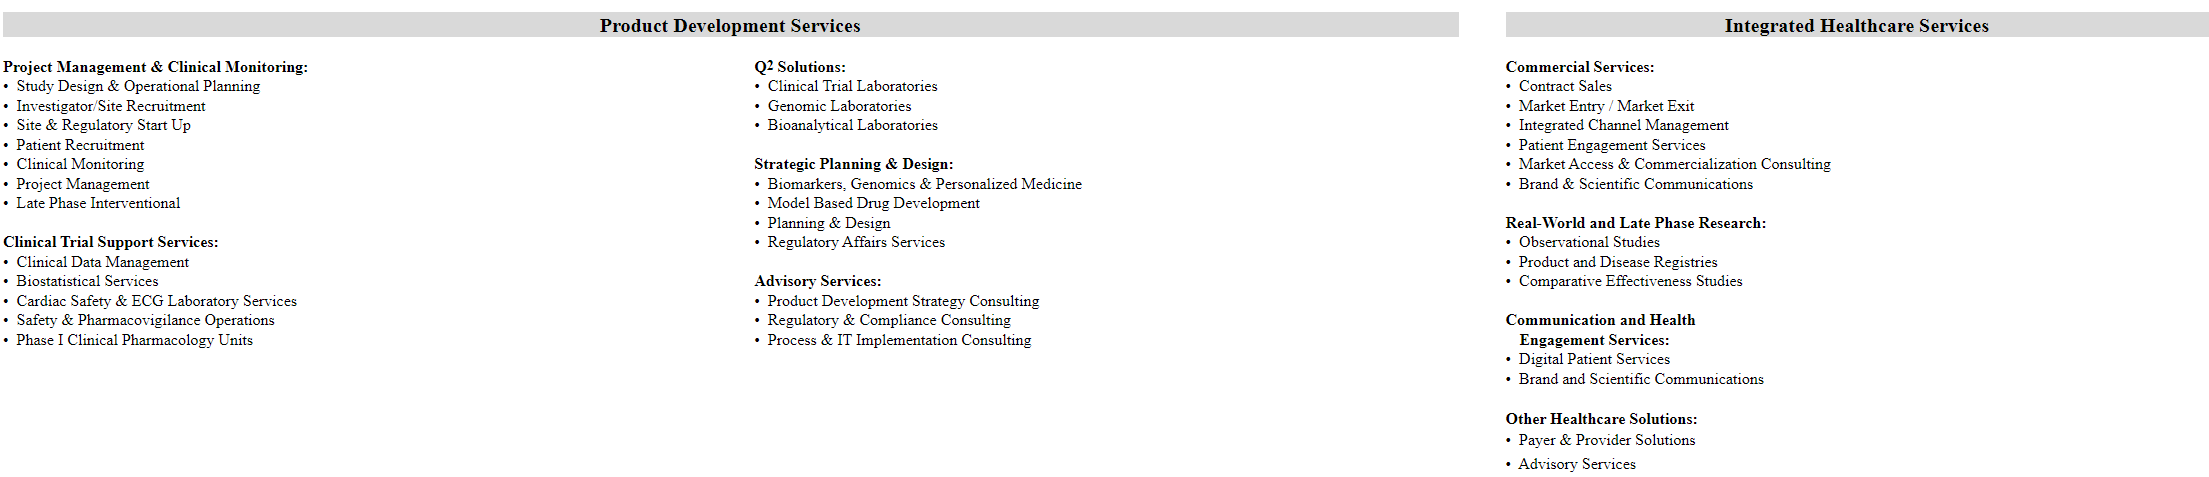
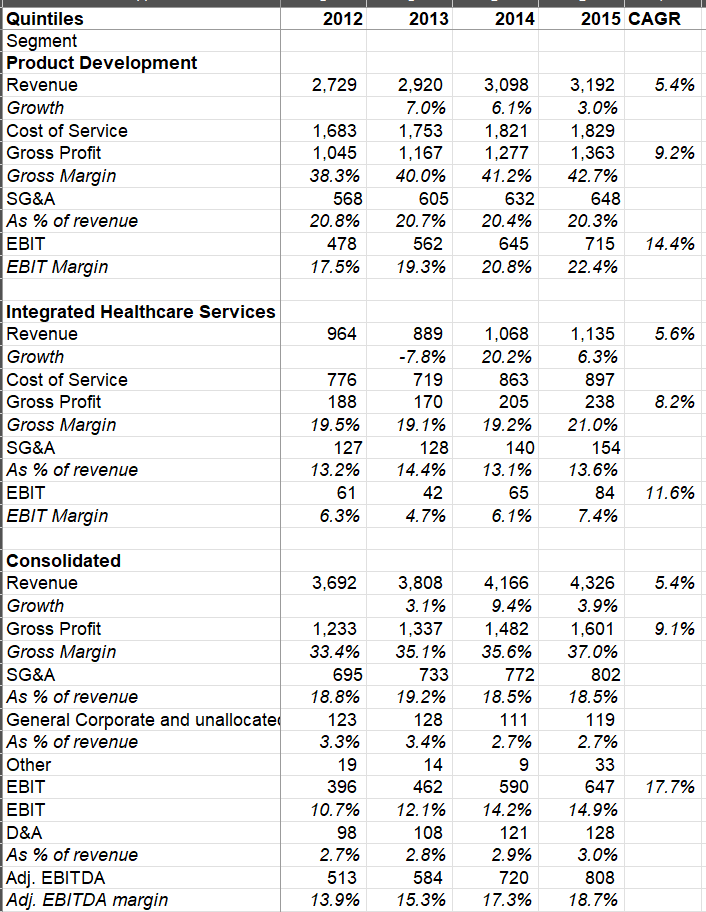
~74% of their 2015 revenue came from their “Product Development” segment which is the largest Contract Research Organization (CRO) focused primarily on Phase II-IV clinical trials and related laboratory and analytical activities.
CROs are contracted or outsourced by the sponsors of clinical trials (such as pharmaceuticals, medical device, and diagnostics companies) to manage and conduct the trials on their behalf. They can manage all aspects of a clinical trial, from study design and planning to execution and closeout, including developing protocols, selecting trial sites, recruiting patients, monitoring the trial, and managing data. CROs help ensure that trials comply with regulations and ethical guidelines and assist with preparing and submitting regulatory documents to agencies like the FDA. They are responsible for collecting, cleaning, storing and analyzing the data generated in clinical trials, and provide statistical analysis and reporting.
By outsourcing these services to CROs, trial sponsors can access specialized expertise, reduce costs, and improve the speed and efficiency of the drug development process. CROs have the infrastructure, resources and experience to run high-quality, compliant clinical trials, allowing pharmaceutical and biotech companies to focus on their core competencies of research and product development.
As per the data shared in 2015, all the top 20 largest biopharmaceutical companies (and 98 out of top 100) are customers of Quintiles. Back in 2015, they had $12 Bn backlog, 28% of which came from top 10 biopharmaceutical companies, 23% from companies ranked as 11-20, 24% from companies ranked as 21-50, and 25% with biopharmaceutical companies outside the top 50.
~26% of Quintiles’ 2015 revenue came from Integrated Healthcare Services (IHS) segment. IHS provides healthcare business services for the broader healthcare sector, such as real world and late phase research, market access and consulting, health information analytics, technology consulting, and other healthcare solutions.
Both product development and IHS segment historically grew at MSD CAGR, but product development has substantially higher margin than IHS. Product Development reported ~40-42% gross margin and ~20-22% operating margin during 2012-15 period whereas IHS segment reported just ~20% gross margin and ~6-7% operating margin.
Now that we have bit of an overview of IMS and Quintiles as standalone companies, let’s get to their merger.
IQVIA: The Merger
In May 2016, IMS Health and Quintiles did an all-stock merger of equals which resulted in pro forma ownership of 51.4% by IMS Health shareholders and 48.6% by Quintiles shareholders.
The rationale for the merger was to realize more efficiency in R&D and demonstrate value and measure outcomes for the customers which management thought would accelerate the topline growth of the combined company by ~100-200 bps by year 3.
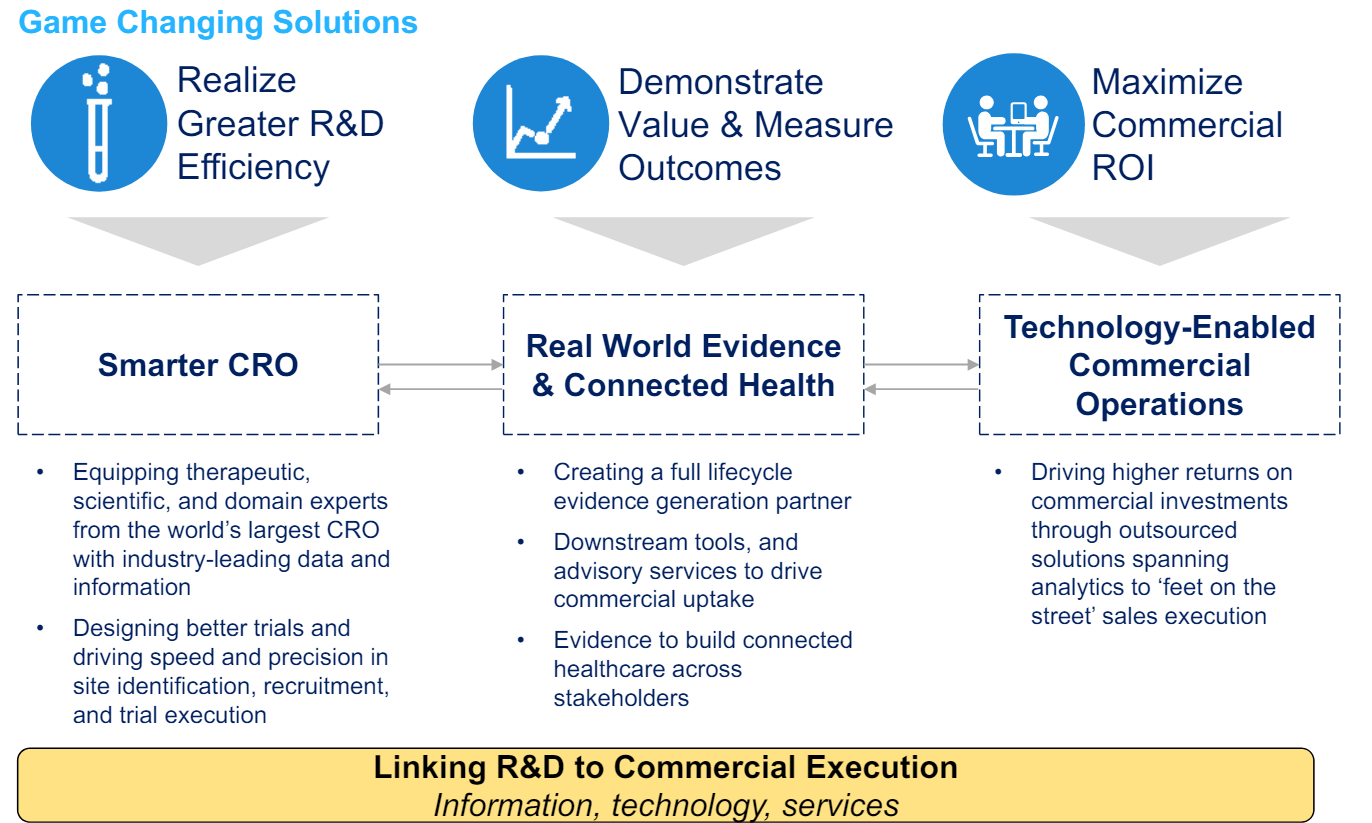
As mentioned earlier, while the merged entity was initially named “QuintilesIMS”, it was later rebranded as “IQVIA” in 2017. The overall business has now three operating segments:
a) Technology & Analytics Solutions (TAS): TAS is mostly the legacy IMS business. Approximately one-third of TAS is the information/data business of IMS that grows at Low Single Digit (LSD) rate. As shown earlier, this is relatively higher margin, non-discretionary source of revenue for TAS.
Beyond the information business, ~20-25% of TAS revenue comes from analytics & consulting which are more discretionary in nature and hence, potentially cancellable/deferrable by the customers depending on the industry/economic cycle.
~30-35% of TAS revenue comes from Real World Solutions segment which focuses on generating evidence and insights from real-world data (RWD) to support life sciences companies. IQVIA’s scaled information networks include ~1.2 Bn unique non-identified patient records globally, as well as access to profiles of over 3,400 real world data assets in ~100 countries facilitating data discoverability for healthcare research via the IQVIA Health Data Catalog.
The rest ~15-20% of TAS revenue is generated from technology platforms which provide range of cloud-based applications and SaaS solutions that support commercial and clinical processes, including CRM, performance management, real-world evidence generation, compliance and safety reporting, incentive compensation, multi-channel marketing, and master data management etc.
Overall, TAS is generally mid to high 20s operating margin business. TAS generally contributes ~40% of IQVIA’s revenue and ~45-50% of the overall operating income.
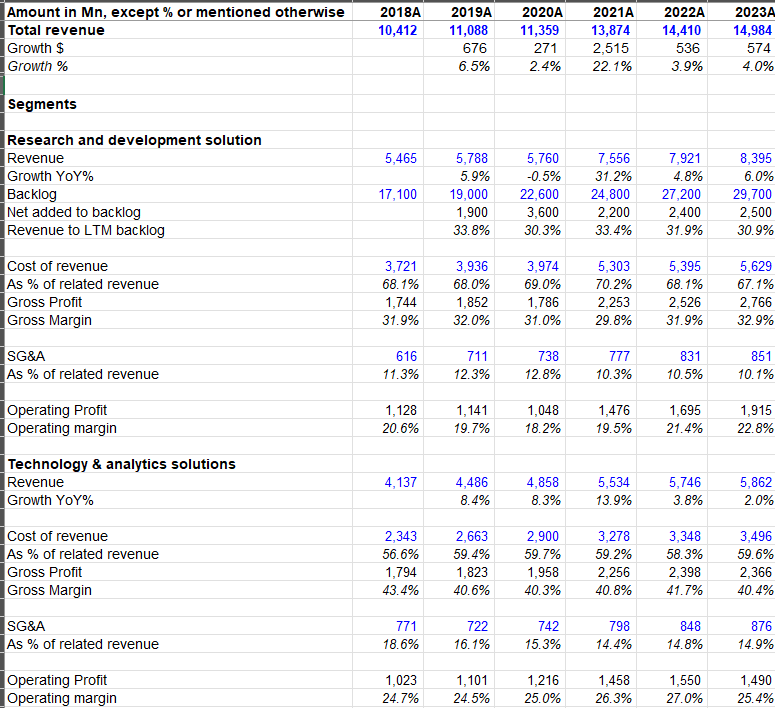
b) Research and Development Solution (RDS): RDS is primarily the legacy “Product Development” or CRO business from Quintiles. IQVIA’s solutions and services enables the efficient conduct and coordination of multi-site clinical trials (generally Phase II-IV). Within RDS segment, IQVIA’s offerings include project management and clinical monitoring, clinical trial support services, laboratory services, strategic planning and design, patient and site centric solutions etc. I will expand on the appeal of CRO business in a later section of this Deep Dive.
At any given point in time, IQVIA is likely working on ~2,500 clinical trials which are staggered through the years, and revenue flows over several years from each one of those trials. RDS currently has ~$30 Bn backlog that has been steadily growing at $2-2.5 Bn per year (except for $3.6 Bn increase in backlog during the pandemic which includes some one-off business). Approximately ~30% of prior year’s backlog tends to convert to revenue in the current year. ~60% of RDS revenue comes from large pharmaceuticals and ~20% of the RDS revenue is generated from Emerging BioPharma (EBP) customers. While EBP segment typically grows faster, ~10% of RDS backlog is from pre-revenue EBP customers which are more speculative in nature i.e. those backlog will not convert to revenue if these clients do not receive funding.
RDS is relatively lower gross margin business (~30% gross margin) but still generates ~20% operating margin. ~15% of RDS revenue is FSP revenue (Functional Service Provider) which is a particularly low margin business and much of the rest is from higher margin full-service revenue. FSP solutions can range from supplementing a client's team with a few individuals to providing dedicated teams across functions or large-scale programs. Basically, some clients want to outsource functional aspects of projects while maintaining control over the overall process and data. While increasing popularity of FSP can put pressure on the margin, it is often necessary to receive a broader mandate from the customers in the future.
When Quintiles was a standalone company, they weren’t too keen on FSP revenue, but IQVIA decided otherwise in the post-merger era:
If you go back to 2015, right before we did the merger. Quintiles had largely turned away from FSP work because it wanted to focus on the higher-margin full-service work. And when we came in, we -- as IMS and Quintiles merged and already took over. He looked at it and said, "No, we want to participate in the whole market." And it's more than just the revenue potential for FSP. It's also that, for certain clients, you've got to play FSP to be in the full service. They might have 60% or 75% FSP, 25% to 40% full service. But to get the full service work, you have to be willing to do the FSP work, too. So we think that was obviously the right move over time to chase that work. And we can talk about the margins, but from a revenue standpoint and booking standpoint, we need to be there.
Overall, RDS is ~55% of revenue and ~50-55% of operating profit of IQVIA.
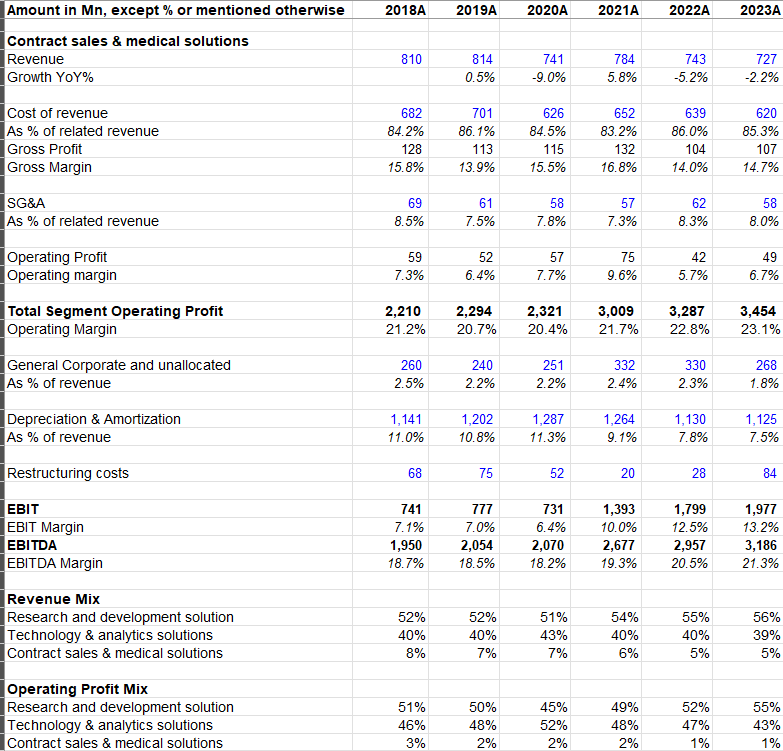
c) Contract Sales and Medical Solutions: This segment is primarily legacy IHS business from Quintiles. It includes health care provider engagement services, patient engagement services, and medical affairs services. While it’s ~5% of the overall IQVIA’s revenue, revenue from this segment is consistently declining over the years. Since this segment has just ~6-7% operating margin, it contributes only ~1% operating profit of IQVIA.
Overall, apart from the one-off pandemic boost, IQVIA has been largely growing at MSD rate with ~20% adjusted EBITDA margin.
Now that we have an overview of IQVIA’s business and its history, let’s discuss the opportunities, risks, and competitive dynamics IQVIA faces.